Raspberry Pi Debug Probe
About the Debug Probe
Edit this on GitHub

The Raspberry Pi Debug Probe is a USB device that provides both a UART serial port and a standard Arm Serial Wire Debug (SWD) interface. The probe is designed for easy, solderless, plug-and-play debugging. It has the following features:
-
USB to Arm Serial Wire Debug (SWD) port
-
USB to UART bridge
-
Compatible with the CMSIS-DAP standard
-
Works with OpenOCD and other tools supporting CMSIS-DAP
-
Open source, easily upgradeable firmware
|
Note
|
For more information on the Raspberry Pi three-pin debug connector see the specification. |
This makes it easy to use a Raspberry Pi Pico on platforms such as Windows, macOS, and Linux that lack a GPIO header to connect directly to the Pico’s serial UART or SWD port.
The Debug Probe
The probe operates at 3.3V nominal I/O voltage.

Included with the Debug Probe is a USB power cable and three debug cables:
-
three-pin JST-SH connector to 3-pin JST-SH connector cable
-
three-pin JST-SH connector to 0.1-inch header (female)
-
three-pin JST-SH connector to 0.1-inch header (male)
The two 0.1-inch header cables — intended for breadboard (male) or direct connection to a board with header pins (female) — are coloured as below:
- Orange
-
TX/SC (Output from Probe)
- Black
-
GND
- Yellow
-
RX/SD (Input to Probe or I/O)
The cable with three-pin JST-SH connectors is intended to be used with the standard three-pin connector that newer Raspberry Pi boards use for the SWD debug port and UART connectors.
|
Warning
|
When the target is powered from a separate power source or computer, ensure a common reference before connecting signal lines. Either remove power from the target or connect GND between the target and the Raspberry Pi Debug Probe first; you can attach RX, TX, SC, and SD after GND is connected. Potential voltage differences between the two systems can cause damage to the probe. |
The Debug Probe has five LEDs, a red LED to indicate power, and four more activity indicator LEDs

|
Note
|
OpenOCD switches both DAP LEDs on when the target is connected, and turns them off when it calls DAP_DISCONNECT.
|
Getting started
Edit this on GitHub

Depending on your setup, there are several ways to wire the Debug Probe to a Pico-series device. Below, we connect the Debug Probe to a Raspberry Pi Pico H which has the newer three-pin JST-SH connector for SWD.
Connect the following:
-
The Debug Probe "D" port to Pico H SWD JST-SH connector
-
The Debug Probe "U" port, with the three-pin JST-SH connector to 0.1-inch header (male):
-
Debug Probe
RXconnected to Pico HTXpin -
Debug Probe
TXconnected to Pico HRXpin -
Debug Probe
GNDconnected to Pico HGNDpin
-
|
Note
|
If you have a non-H Pico or Pico W (without a JST-SH connector) you can still connect it to a Debug Probe. Solder a male connector to the SWCLK, GND, and SWDIO header pins on the board. Using the alternate 3-pin JST-SH connector to 0.1-inch header (female) cable included with the Debug Probe, connect to the Debug Probe "D" port. Connect SWCLK, GND, and SWDIO on the Pico or Pico W to the SC (orange wire), GND (black wire), and SD (yellow wire) pins on the Debug Probe, respectively.
|

Install tools
Edit this on GitHub
To use the Debug Probe, OpenOCD and the GNU Project Debugger (GDB) are required. An Integrated Development Environment (IDE) may also be useful.
On Raspberry Pi OS, most Linux variants, macOS, and Microsoft Windows, it is recommended to install our VS Code extension. This extension bundles OpenOCD, Arm toolchains, GDB, and register definitions for Pico-series microcontrollers.
See Chapter 3 of our Getting Started with Raspberry Pi Pico guide.
Alternatively, tools can be manually installed by following Appendix C in the guide.
|
Note
|
Manual installation of the tools on Windows is not recommended. |
Starting a Debug Session
Edit this on GitHub
The Debug Probe will let you load binaries via the SWD port and OpenOCD: you will not need to unplug, and then push-and-hold, the BOOTSEL button every time you push a new binary to your Pico. Using the Debug Probe to upload new binaries is an entirely hands-off affair.
GDB is then used to debug the binary running on the Pico.
We recommend the use of the Raspberry Pi Pico VSCode extension, which integrates the use of OpenOCD and GDB, to upload and debug programs. See Chapter 4 of Getting started with Raspberry Pi Pico for more information.
Standalone program upload
After you have built a binary:
$ sudo openocd -f interface/cmsis-dap.cfg -f target/rp2040.cfg -c "adapter speed 5000" -c "program blink.elf verify reset exit"|
Note
|
When you use the Debug Probe to upload a binary the ELF version of the file is used, not the UF2 file that you would use when you drag-and-drop. |
Standalone debug session
This will use openocd in server mode, and connect GDB, which gives you breakpoints and single-step over a console interface.
|
Important
|
To allow debugging, you must build your binaries as $ cd ~/pico/pico-examples/ $ rm -rf build $ mkdir build $ cd build $ export PICO_SDK_PATH=../../pico-sdk $ cmake -DCMAKE_BUILD_TYPE=Debug .. $ cd blink $ make -j4 In a debug build you will get more information when you run it under the debugger, as the compiler builds your program with the information to tell GDB what your program is doing. |
|
Note
|
For computers that are not Raspberry Pis, a variant of GDB that can debug Arm processors is required. Use one of the following alternatives depending on your operating system and device:
* On Linux devices, use gdb-multiarch.
* On macOS and Windows devices, use arm-none-eabi-gdb from the toolchain on Arm’s website
|
To start an OpenOCD server, run the following command:
$ sudo openocd -f interface/cmsis-dap.cfg -f target/rp2040.cfg -c "adapter speed 5000"Then open a second terminal window, switch to the directory containing your built binary, and start a debugger to attach it to the OpenOCD server:
$ gdb blink.elf
> target remote localhost:3333
> monitor reset init
> continue
Serial connections
Edit this on GitHub
Ensure that the Debug Probe is connected to the UART pins of your Raspberry Pi Pico.
The default pins for Raspberry Pi Pico UART0 are as follows:
| Default UART0 | Physical Pin | GPIO Pin |
|---|---|---|
GND |
3 |
N/A |
UART0_TX |
1 |
GP0 |
UART0_RX |
2 |
GP1 |
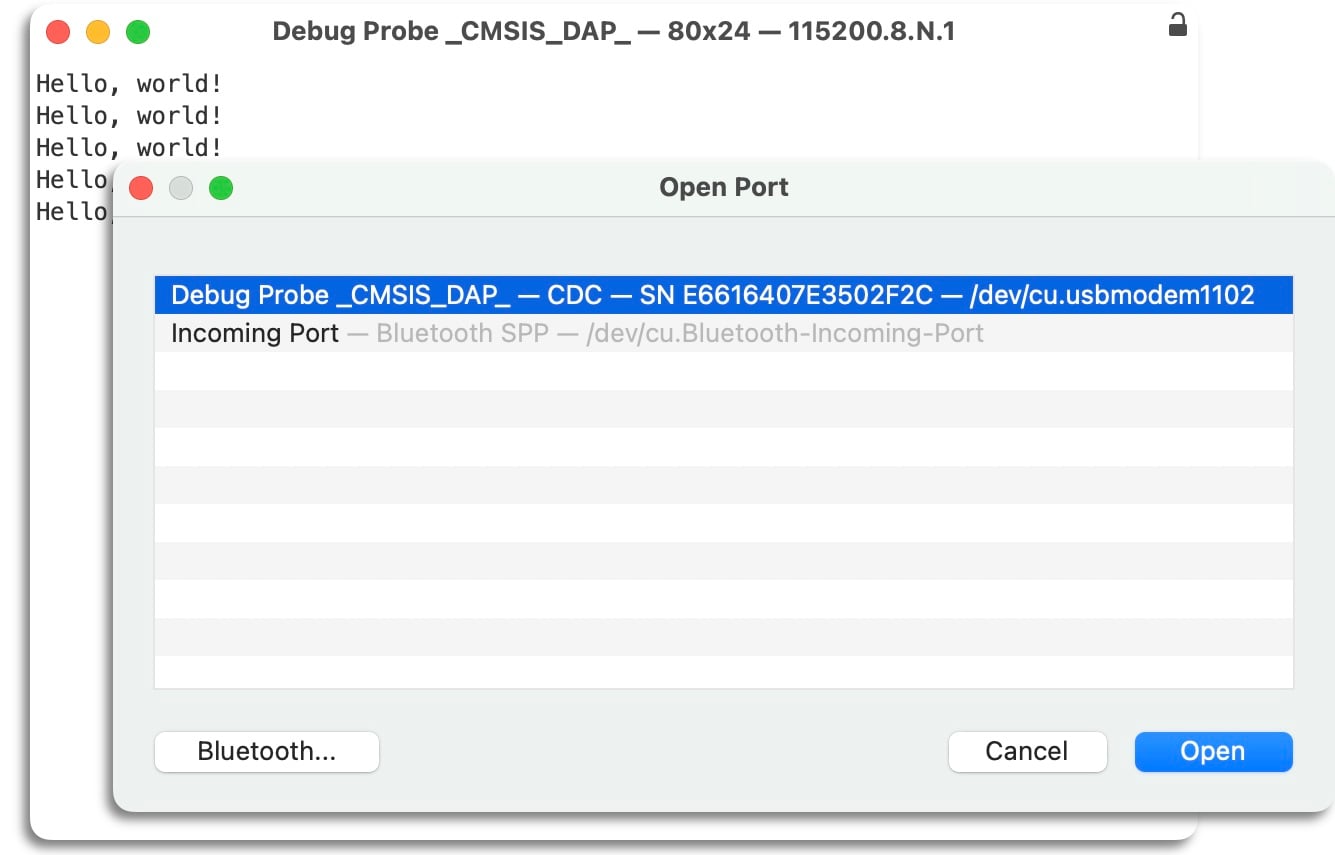
When connected, traffic over the Raspberry Pi Pico’s UART will be relayed to your computer by the Debug Probe and exposed as a CDC UART. On a Raspberry Pi this will show up as /dev/ttyACM0; on other platforms this serial port will show up differently (for example, on macOS it will appear as /dev/cu.usbmodemXXXX).
If you have not already done so you should install minicom:
$ sudo apt install minicomand open the serial port:
$ minicom -b 115200 -o -D /dev/ttyACM0|
Tip
|
To exit minicom, use CTRL-A followed by X.
|
To test serial communication you can build and upload the "Hello World" example application.
Change directory into the hello_world directory inside the pico-examples tree, and run make. Afterwards, you can upload it to your Raspberry Pi Pico using openocd. For a full walkthrough of building the hello_serial example program, see Chapter 4 of Getting started with Raspberry Pi Pico.
$ cd pico-examples
$ mkdir build
$ cd build
$ export PICO_SDK_PATH=../../pico-sdk
$ cmake ..
$ cd hello_world/serial
$ make -j4
$ sudo openocd -f interface/cmsis-dap.cfg -f target/rp2040.cfg -c "adapter speed 5000" -c "program hello_serial.elf verify reset exit"
$ minicom -b 115200 -o -D /dev/ttyACM0
On opening minicom you should see "Hello, world!" printed to the console.
For terminal programs that support it, a description of the USB serial UART is advertised in the USB device description.
The unique serial number in this description means that on Windows your COM port numbering is "sticky" per device, and will allow you to write udev rules to associate a named device node with a particular Debug Probe.
RTT connections
You can also configure your application to send its output directly over the SWD interface without the need for a UART connection. This uses a mechanism called Segger Real-Time Transport (RTT).
To do this, you must enable the RTT stdio driver in your application and connect to RTT with the Debug Probe.
|
Note
|
You must use a debug build of your application to send output over SWD. |
Enabling the RTT stdio driver
The C/C++ SDK provides a stdio driver for RTT just like the ones for UART and USB. For more information, see pico_stdio_rtt.
To enable the driver in your build, include the following line in your CMakeLists.txt file (or link with pico_stdio_rtt which does the same thing):
pico_enable_stdio_rtt(<your_project_name> 1)After calling stdio_init_all(), any output that your application sends with printf() is sent to RTT. If you want to copy your output to the UART as well, you can enable that too.
Connecting to RTT from VSCode
RTT is supported by OpenOCD and the VSCode Cortex-Debug extension; both of these are set up as part of installing the tools.
To enable RTT for a debug session add a section to its launch configuration. Open your project’s .vscode folder and add the following lines to the launch.json file, putting them in the appropriate configuration section, such as "Pico Debug (Cortex-Debug)":
"rttConfig": {
    "enabled": true,
    "address": "auto",
    "decoders": [
        {
            "label": "",
            "port": 0,
            "type": "console"
        }
    ]
}
For more information, see cortex-debug launch attributes.
If you now launch a debug session on an RTT-enabled application and open the TERMINAL tab, you see a list on the right that includes RTT Ch:0 console. Select this to see the output that your application sends to the pico_stdio_rtt driver.
Connecting to RTT in a standalone debug session
If you are using a standalone debug session as described in Starting a Debug Session, you can connect to RTT by completing the following steps:
-
Build and upload your RTT-enabled application.
-
Connect the Debug Probe and start
openocdandgdbin separate terminals. For more information, see Standalone debug session. -
At the
gdbprompt enter the following commands:(gdb) target remote localhost:3333 (gdb) monitor reset init (gdb) monitor rtt setup 0x20000000 2048 "SEGGER RTT" (gdb) monitor rtt start (gdb) monitor rtt server start 60000 0 (gdb) continueNoteThe gdbcommands prefixed withmonitorare passed through toopenocd. For more information about the commands used here, see section 15.6 of the OpenOCD Manual.OpenOCD searches for an RTT control block on the target and then creates a local TCP socket on port 60000.
-
Open a third window and connect to the local socket with a tool like
nc(netcat) or equivalent to see the RTT output from your application:$ nc localhost 60000
Updating the firmware on the Debug Probe
Edit this on GitHub
Firmware for the Debug Probe is available as a UF2 file distributed by Raspberry Pi.
The latest version of the Debug Probe firmware is version 2.3.1. If you’re running an older version, or if you have accidentally overwritten the firmware on your Debug Probe, you can find the latest release of the firmware in the debugprobe GitHub repository.
To check the firmware version of your Debug Probe, run:
$ lsusb -v -d 2e8a:000c | grep bcdDeviceThis reports bcdDevice 2.31 for Debug Probe firmware version 2.3.1.
|
Note
|
The Info : CMSIS-DAP: FW Version = 2.0.0 line reported by openocd only refers to the CMSIS-DAP protocol level (which is different to the Debug Probe firmware version).
|
To update the firmware version of your Debug Probe:
-
Download
debugprobe.uf2from the latest release. -
Pinch to remove the top of the Debug Probe enclosure.
-
Push and hold the BOOTSEL button as you plug the Debug Probe into your computer, to mount a volume called RPI-RP2 (Pico) or RP2350 (Pico 2).
-
Copy
debugprobe.uf2onto the mounted volume. The volume will dismount automatically after the file finishes copying onto the device. -
Your Debug Probe reboots and now runs an updated version of the Debug Probe firmware. It is now ready for debugging.
Schematics
Edit this on GitHub
Schematics and mechanical drawing of the Debug Probe are available:
-
Schematics (PDF)
-
Mechanical Diagram (PDF)
The test point (TP) shown on the schematics are located as shown in the diagram below.
