LEGO spectrometers
First-year Computer Science projects from Imperial College in London have been providing us with some really, really cool stuff for this blog over the last couple of years. Not to be outdone, the Chemistry faculty have hopped on board the Raspberry Pi bus as well – only they’re using LEGO too, which we calculate to be worth at least an extra eleven cool points.
I do not recall my own bright college days being anything LIKE this.
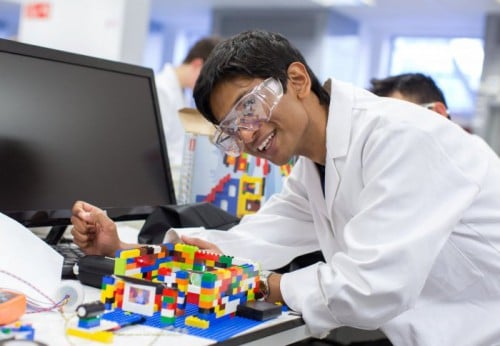
Students studying Chemistry are being set a challenge: they have to design and build and optimise a UV-Vis spectrometer using LEGO. They then have to refine the design and make it as sensitive as they can, using a number of samples, learning about instrumental limitations in the process. A Raspberry Pi collects the data – which means that the students have to learn how to use Linux and write some Python as part of the project.

Dr Joshua Edel, who ran the project, says:
“This is the first time we’ve done this type of project. It’s the students’ first introduction into measurement sciences and we wanted to create a fun problem solving element to what they’re doing and at the same time ensure they refine their analytical skills.”

Some spectrometers sprouted tiny LEGO trees; one had flags representing the nationalities of everybody who’d worked on them attached. At least one was built in the shape of a Greek temple.
The plan is to roll a simplified version of this project out to schools, teaching much younger kids that light is much more involved than the visible spectrum might have them believe. And that LEGO and Raspberry Pi make, as always, a beautiful partnership.


12 comments
tony abbey
Why do they all have to wear those silly spectacles to smile at a load of Lego?
G
You obviously do not know how dangerous Lego is. This is just a pre-emptive measure for a new European safety ruling. Soon all kids playing with Lego will be obliged to wear them with gloves and protective clothing.
JBeale
I’d love a little more detail on how the actual spectrometer works. Are they using a lens, aperture, transmission grating, and R-Pi camera, as a guess? Is everyone doing their own control software also?
Liz Upton
We don’t know, unfortunately – I hope someone involved in the project will chime in!
MalMan35
Hi,
I am Malachi and I am 14 and I just want to say thank you for the raspberry pi starter kit you sent me for the Christmas competition 2014. I really appreciate it and the time you spent to send that to me and others who may have won. Raspberry pi is what has gotten me interested in computer coding (before that I had just been playing with snap circuits) and has really got me exited about web developing and a lot of other things! (I first heard about RPI from my dad who heard about it on a tec podcast) As they say in Japan where I live (I am American) がんばて which means keep going.
~
Malachi
David Fildes
This is awesome. I wish we had got to do something like this when I did my chemistry degree, it would have been amazing. I think I will have to build my own.
BoB LeSuer
The MagPi published my article on how to build a rudimentary spectrometer using the RPi (and I thought it was blogged about here at one point, but I can’t seem to find the link). I’ve also put some ideas on my website (www.bobthechemist.com) on converting the MagPi design into something that gives actual spectra (the MagPi article uses a single wavelength source).
The simple photometer model, with an LED as the source and no diffraction grating, is very easy to build and can be done with a few dollars worth of parts. I’ve used this setup to teach my students the basics of data acquisition (ADC conversion and the use of OpAmps in scientific instrumentation). Creating a multi-wavelength system can be done cheaply with education-grade diffraction gratings (or broken CDs!) but requires more class time than I’ve been able to devote to this part of the course.
Jeff (fos)
I am a retired science teacher. Schools and particularly chemistry departments require eye protection anytime you step into a chemistry lab. The object is to make it automatic. Even if you are working on something that would be totally safe, your neighbor or someone else in the lab may not be. Eyes are too valuable not to protect.
fos
tony abbey
I suppose that means that the days of making explosives and blowing your fingers off are over, then, or is that still allowed if you wear goggles?
AndrewS
There’s already been many arguments along that theme… ;-)
e.g. https://www.raspberrypi.org/fran-scott-at-bett/#comment-1189721
Matt Healy
When I was an engineer, we had a simple rule: the third time you were caught in the production area without eye protection you were a former employee.
Matt Healy
Here’s my sketch of how I would design the optical system if it were my assignment:
https://drive.google.com/file/d/0B6c5iF3j1EXhbGtRTTN2dDhwU0F1c1lsa2JwbW1ZZ1lrb0ZJ/view?usp=sharing
All you’re really doing is picking a narrow wavelength range from white light with a diffraction grating (which could be a music CD) and measuring how much gets absorbed when it passes through your sample. Typically you’ll run a “blank” with distilled water before and after your “unknown” sample in order to calculate absorbance. The wavelength chosen will depend on the solute or solutes being assayed. For a single solute the math is quite simple; it can get more complicated when assaying a mixture of solutes.
This is a great choice for a class assignment, because it’s one of the simplest useful devices in a research lab or medical facility.
Back in the day, I used a Spectronic-20, a workhorse analog spectrometer you’ll still find in many labs today. The Spec-20 used an incandescent bulb for the light source, and read the photocell output with a simple analog meter movement. We’d plot readings for samples with various known concentrations of solute on graph paper to draw a standard curve. These students probably fit an equation by least squares to the calibration data.
Comments are closed