Build a weather station with a web dashboard | HackSpace #58
With the Pimoroni Weather HAT and Sensors Kit, you can upload your data to an easily accessible web dashboard. In the latest issue of HackSpace magazine, out now, Phil King show you how.
While it’s possible to build a DIY Raspberry Pi weather station from separate components and sensors, Pimoroni’s Weather HAT makes the process far simpler and easier. As well as on-board BME280 (temperature, pressure, humidity) and LTR‑559 (light) sensors, the HAT features a Nuvoton microcontroller with a 12-bit ADC to read analogue signals reliably from external weather sensors connected via standard RJ11 ports. It even has a mini colour LCD screen to display readings.

The Weather Sensors Kit comprises three meteorological sensors: an anemometer to measure wind speed, a wind vane for direction, and ‘tipping bucket’ rainfall gauge. Alternatively, you may already have similar sensors or be able to source them elsewhere, but you’ll need a couple of RJ11 connectors to plug them into the HAT – with wind speed and direction sensors routed through one connector. Either way, let’s get started.
01. Set up Raspberry Pi
If you don’t already have a recent version of Raspberry Pi OS written to your microSD card, use Raspberry Pi Imager to do so from another computer. While you’re at it, click the cog icon in Imager to access the Advanced Options. Here you can enable SSH (useful for remote operation later), set a username and password, and configure your WiFi connection. You may also want to change the hostname to something like ‘weather.local’, to make it easier to identify your weather station Raspberry Pi on the network (rather than using its IP address).
02. Mount the HAT
With your Raspberry Pi powered off, mount the Weather HAT on its GPIO header, with the body of the HAT over that of Raspberry Pi. You can use any Raspberry Pi model with a 40-pin header; we chose a Raspberry Pi Zero W for our setup and connected to it via SSH rather than using a monitor for setup. You can add standoffs and screws through the mounting holes next to the header (and the others if using a full-size Raspberry Pi) to secure the HAT more firmly.

03. Install the software
With Raspberry Pi connected to a monitor and keyboard, open a Terminal window. Alternatively, access it remotely via SSH from another device. Enter the following commands to install the Weather HAT library:
 git clone https://github.com/pimoroni/
weatherhat-python
 cd weatherhat-python
 sudo ./install.sh
This will automatically enable the I2C and SPI interfaces and install some additional software required for the HAT to work. In addition, the folder will include an examples subfolder of code examples. To be able to run these, you’ll need to install some extra fonts and dependencies:
 sudo pip3 install fonts font-manrope pyyaml
adafruit-io numpy
Note: If you’re using the Lite version of Raspberry Pi OS, you may also need to install some additional software before the commands above will work. To do so, enter:
 sudo apt install python3-pip git libatlas-
base-dev
Now reboot Raspberry Pi with sudo reboot, for the changes to take effect.
04. Initial testing
With the software installed and Raspberry Pi rebooted, let’s do a quick test of the HAT’s on-board sensors. Change directory to the examples folder and run the main Python code demo:
cd weatherhat-python/examples

python weather.py
The default screen on the LCD will show several sensor readings. Since the external sensors are yet to be connected, you will only see those for the on-board BME280 and LTR-559 sensors for now: temperature, pressure, humidity, and light. We’ll test the external sensors following assembly.
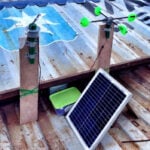
05. External sensors assembly
First, slide the two metal tubes together to make the mast. Then add the longer armature to the top of the mast, securing it with a screw. Mount the anemometer and wind vane securely on either side of the armature. The rain gauge fits onto a shorter armature further down the mast, clear of the other sensors so they don’t interfere with its operation. For more detailed build instructions, see SparkFun’s assembly guide.

The wires from the wind sensors can be kept neat using the built-in cable clips on the top armature. The anemometer’s RJ11 connector fits into a port on the underside of the wind vane. As you’d expect, the rain gauge connector goes into the ‘Rain’ port on the Weather HAT, while that coming from the wind vane goes into the ‘Wind’ port – note that this cable is thicker, as it carries four wires (for both wind sensors) instead of two.
06. Test again
With the external sensor assembly complete, and the connectors inserted into the correct ports on the HAT, let’s test they’re all working correctly.
Run the weather.py code example, as in Step 4. This time, you should see two extra readings at the top of the LCD’s default screen: for rain (in mm/s) and wind (speed in m/s). Try spinning the anemometer and you’ll see the wind reading increase. Similarly, try tilting the rainfall gauge up and down to make the internal bucket tip (you’ll hear a clicking noise) and you should see the rain reading rise.
Pressing the X button on the HAT will change the numerical readings to graphs. Repeatedly pressing A will show specific displays for different sensors. With the wind display selected, test the wind vane by rotating it to different positions; the graph should change to show the direction.

07. Taking it outside
There’s little point getting weather readings from inside the house, so it’s time to take our weather station outdoors. You could site the external sensors mast by sticking it firmly into the ground, or securing it to a downpipe with the supplied jubilee clip (gear clamp). Alternatively, as we did, you can use standard zip cable ties to secure the sensor mast to a garden fence post. You could even use a TV aerial mast to mount it on the side of a garage. Ideally, try to avoid siting the weather station too close to trees or other obstructions that may affect the wind and rain readings. Before securing it firmly in place, check Step 8 to calibrate the wind vane.
Since the sensor cables are roughly 3 m in length, you’ll need to position Raspberry Pi fairly nearby unless using cable extenders. Naturally, you’ll need to protect it from the rain, so you could use a standard weatherproof case or, even better, a Stevenson screen for better ventilation. We simply ran the cables through a window to Raspberry Pi in our garage, although this does give inflated temperature readings on hot days.

08. Wind vane calibration
To obtain an accurate compass direction reading from the wind vane, you’ll need to make sure it’s pointing north when its reading is north. To do so, use a standard compass, or an app on your smartphone, to determine in which direction north is.
The wind vane sensor has four barely visible protrusions on its body. When the shorter end of the vane is pointing toward the protrusion nearest where the main cable (going to the HAT) comes out, it’s pointing north. You can double-check this by running the weather.py demo code and rotating the vane so it reads north.
Now rotate the whole mast so that the north end of the wind vane is actually pointing north. Secure it tightly in place so it can’t move out of position. You will also want to check that the rain gauge is level, by ensuring that the small spirit level bubble on it is centred.
09. Set up Adafruit IO
While there are numerous options for logging and charting your data locally or online, the easiest way is to use the Adafruit IO code example to set up a web dashboard that you can view from any device.
First, point a web browser to io.adafruit.com, click Get Started for Free, and enter your details for a free Adafruit IO account. Click on My Key to see your username and active key. On Raspberry Pi, go to the examples folder and edit the code file with:
sudo nano adafruit-io.pyNow alter the following lines by adding your key and username between the single quote marks:
 ADAFRUIT_IO_KEY = 'YOUR AIO KEY HERE'
 ADAFRUIT_IO_USERNAME = 'YOUR AIO USERNAME
HERE'
Press CTRL+X, then Y to exit and save the file. Then run it with:
python adafruit-io.pyThis will automatically create a Weather dashboard in your Adafruit IO account and populate it with the sensor feeds. Now, you just need to design the web dashboard.
10. Design dashboard
In your Adafruit IO account, open up the weather dashboard. Click the cog icon and Create New Block. Let’s start with a temperature graph: select the Line Chart option. In the list of sensor feeds, tick Temperature and then click Next Step. Enter a block title for it, e.g. ‘Temperature’, leave the other options unchanged, and click Create Block. It will now appear on the dashboard.
Let’s add a real-time temperature gauge. Click the cog and Create New Block, then select the Gauge option. Tick the Temperature feed again and click Next Step, then give it a title, alter the min and max values to your preference (e.g. -20 and 50), and add ‘Celsius’ as the label. Click Create Block and it’ll appear on the dashboard, under the chart.

Using the same process, continue to add dashboard widgets for other sensor feeds, to your preference. We also added a Stream widget to show all the live sensor feeds. You can create a chart for multiple feeds if you like, such as rain and humidity (as we did); you can then select to show/hide each feed by clicking its colour-coded rectangle in the chart key.
To reposition blocks, click the cog icon and Edit Layout, then click and drag the blocks around. You can also click the cog icon on a block to edit it, and alter the history duration for charts. When happy, click Save Layout.
11. Run from boot
With your web dashboard set up and the data uploading correctly, you’ll want to get your adafruit-io.py script to run automatically on bootup. To do so, enter crontab -e and add the following line at the bottom of the file:
 @reboot python /home/pi/weatherhat-python/
examples/adafruit-io.py &
Press CTRL+X, then Y to save it. Now, even if the power goes off temporarily, when your Raspberry Pi reboots, the script will start running again and continue uploading data.
HackSpace magazine issue 58 out NOW!
Each month, HackSpace magazine brings you the best projects, tips, tricks and tutorials from the makersphere. You can get HackSpace from the Raspberry Pi Press online store or your local newsagents.

As always, every issue is free to download in PDF format from the HackSpace magazine website.


No comments
Comments are closed