The Weather Station and the eclipse
As everyone knows, one of the problems with the weather is that it can be difficult to predict a long time in advance. In the UK we’ve had stormy conditions for weeks but, of course, now that I’ve finished my lightning detector, everything has calmed down. If you’re planning to make scientific measurements of a particular phenomenon, patience is often required.
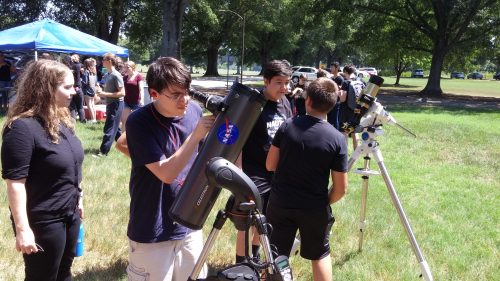
Wake STEM ECH get ready to safely observe the eclipse
In the path of the eclipse
Fortunately, this wasn’t a problem for Mr Burgess and his students at Wake STEM Early College High School in Raleigh, North Carolina, USA. They knew exactly when the event they were interested in studying was going to occur: they were going to use their Raspberry Pi Oracle Weather Station to monitor the progress of the 2017 solar eclipse.
Through the @Celestron telescope #Eclipse2017 @WCPSS via @stemburgess pic.twitter.com/5LG3bGAMUm
— Wake STEM EC HS (@WakeSTEMECHS) August 21, 2017
Measuring the temperature drop
The Raspberry Pi Oracle Weather Stations are always active and recording data, so all the students needed to do was check that everything was connected and working. That left them free to enjoy the eclipse, and take some amazing pictures like the one above.
You can see from the data how the changes in temperature lag behind the solar events – this makes sense, as it takes a while for the air to cool down. When the sun starts to return, the temperature rise continues on its pre-eclipse trajectory.

Weather station data 21st Aug: the yellow bars mark the start and end of the eclipse, the red bar marks the maximum sun coverage.
Reading Mr Burgess’ description, I’m feeling rather jealous. Being in the path of the Eclipse sounds amazing: “In North Carolina we experienced 93% coverage, so a lot of sunlight was still shining, but the landscape took on an eerie look. And there was a cool wind like you’d experience at dusk, not at 2:30 pm on a hot summer day. I was amazed at the significant drop in temperature that occurred in a small time frame.”
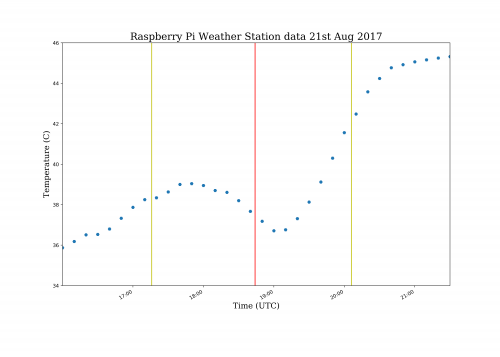
Close up of data showing temperature drop as recorded by the Raspberry Pi Oracle Weather Station. The yellow bars mark the start and end of the eclipse, the red bar marks the maximum sun coverage.
Weather Station in the classroom
“I’ve been preparing for the solar eclipse for almost two years, with the weather station arriving early last school year. I did not think about temperature data until I read about citizen scientists on a NASA website,” explains Mr Burgess, who is now in his second year of working with the Raspberry Pi Oracle Weather Station. Around 120 ninth-grade students (ages 14-15) have been involved with the project so far. “I’ve found that students who don’t have a strong interest in meteorology find it interesting to look at real data and figure out trends.”
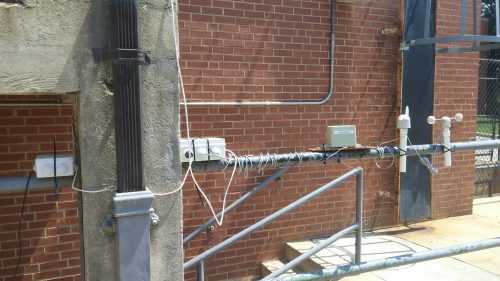
Wake STEM EC Raspberry Pi Oracle Weather Station installation
As many schools have discovered, Mr Burgess found that the biggest challenge with the Weather Station project “was finding a suitable place to install the weather station in a place that could get power and Ethernet“. To help with this problem, we’ve recently added two new guides to help with installing the wind sensors outside and using WiFi to connect the kit to the Internet.
Raspberry Pi Oracle Weather Station
If you want to keep up to date with all the latest Raspberry Pi Oracle Weather Station activities undertaken by our network of schools around the world, make sure you regularly check our weather station forum. Meanwhile, everyone at Wake STEM ECH is already starting to plan for their next eclipse on Monday, April 8, 2024. I wonder if they’d like some help with their Weather Station?

8 comments
W Robinson
Way to go Wake STEM ECHS! Mr. Burgess, you are an awesome teacher. I like the way you use real data to encourage/motivate students.
D Schwenker
One of the many great things happening at Wake STEM – a truly wonderful school that prepares all students for college and careers. Mr. Burgess and the teachers – KUDOS to you all.
miles archer
You should check out the open source weewx weather station software. It’s great. I run it on a 2b, though I use an external weather station to provide the data.
Chris
Looks interesting. I’ve been using PyWWS which is similar but doesn’t have as much hardware support.
I did see the temperature dip in my graph for the 2015 eclipse. I might have to re-graph that data and archive it somewhere, as the original is lost in time (it’ll be on the @BedfordWeather Twitter feed if you fancy scrolling back that far!)
beta-tester
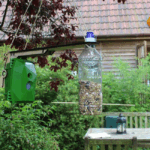
the third photo, on the rail, what is mounted there?
a box, a wind direction indicator, a wind speedometer…
… what, wait… a wind direction indicator?
2 m in front of a building and 1m above the ground.
that installation is not that effective?
ok, i know, that installation is for teaching purpose…
and they only took a look to the temperature…
but still funny.
beta-tester
oops, i can’t count, its not the third photo… :D
Bill
The location is not ideal, obviously, but it’s the best we could considering the RPi needs direct access to a power outlet and ethernet port. We are surrounded by concrete, and have no access to the roof. We were lucky to set it up at this location.
DatOneTechie
I agree. Although pick yourself up some RPi 3s
Comments are closed