2017 Weather Station round-up
As we head into 2018 and start looking forward to longer days in the Northern hemisphere, I thought I’d take a look back at last year’s weather using data from Raspberry Pi Oracle Weather Stations. One of the great things about the kit is that as well as uploading all its readings to the shared online Oracle database, it stores them locally on the Pi in a MySQL or MariaDB database. This means you can use the power of SQL queries coupled with Python code to do automatic data analysis.
Soggy Surrey
My Weather Station has only been installed since May, so I didn’t have a full 52 weeks of my own data to investigate. Still, my station recorded more than 70000 measurements. Living in England, the first thing I wanted to know was: which was the wettest month? Unsurprisingly, both in terms of average daily rainfall and total rainfall, the start of the summer period — exactly when I went on a staycation — was the soggiest:
What about the global Weather Station community?
Even soggier Bavaria
Here things get slightly trickier. Although we have a shiny Oracle database full of all participating schools’ sensor readings, some of the data needs careful interpretation. Many kits are used as part of the school curriculum and do not always record genuine outdoor conditions. Nevertheless, it appears that Adalbert Stifter Gymnasium in Bavaria, Germany, had an even wetter 2017 than my home did:
Where the wind blows
The records Robert-Dannemann Schule in Westerstede, Germany, is a good example of data which was most likely collected while testing and investigating the weather station sensors, rather than in genuine external conditions. Unless this school’s Weather Station was transported to a planet which suffers from extreme hurricanes, it wasn’t actually subjected to wind speeds above 1000km/h in November. Dismissing these and all similarly suspect records, I decided to award the ‘Windiest location of the year’ prize to CEIP Noalla-Telleiro, Spain.
This school is right on the coast, and is subject to some strong and squally weather systems.
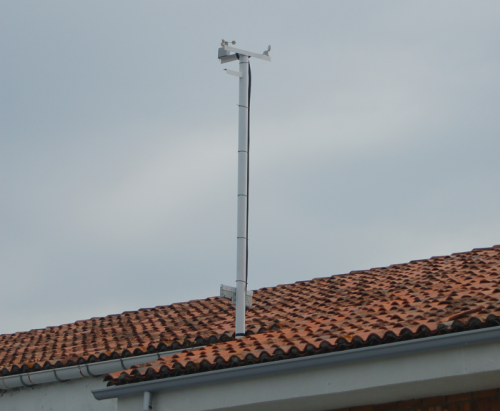
Weather Station at CEIP Noalla-Telleiro
They’ve mounted their wind vane and anemometer nice and high, so I can see how they were able to record such high wind velocities.
A couple of Weather Stations have recently been commissioned in equally exposed places — it will be interesting to see whether they will record even higher speeds during 2018.
Highs and lows
After careful analysis and a few disqualifications (a couple of Weather Stations in contention for this category were housed indoors), the ‘Hottest location’ award went to High School of Chalastra in Thessaloniki, Greece. There were a couple of Weather Stations (the one at The Marwadi Education Foundation in India, for example) that reported higher average temperatures than Chalastra’s 24.54 ºC. However, they had uploaded far fewer readings and their data coverage of 2017 was only partial.
At the other end of the thermometer, the location with the coldest average temperature is École de la Rose Sauvage in Calgary, Canada, with a very chilly 9.9 ºC.
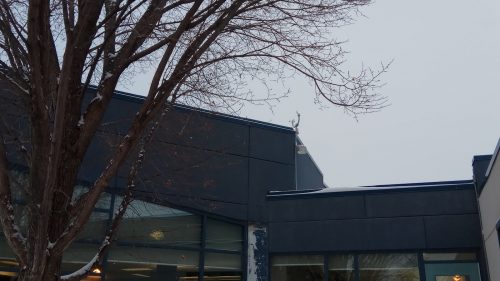
Weather Station at École de la Rose Sauvage
I suspect this school has a good chance of retaining the title: their lowest 2017 temperature of -24 ºC is likely to be beaten in 2018 due to extreme weather currently bringing a freezing start to the year in that part of the world.
Analyse your own Weather Station data
If you have an Oracle Raspberry Pi Weather Station and would like to perform an annual review of your local data, you can use this Python script as a starting point. It will display a monthly summary of the temperature and rainfall for 2017, and you should be able to customise the code to focus on other sensor data or on a particular time of year. We’d love to see your results, so please share your findings with [email protected], and we’ll send you some limited-edition Weather Station stickers.


13 comments
Rich Steed
Are these ever going to be available to buy – would love one for my school!
Brian Williams
Don’t expect a reply. These reports remind me of Ben Heck’s projects (or Heston Blumenthal’s cooking)… look at what I (we) can do, but you can’t!
Raspberry Pi Staff Richard Hayler — post author
Unfortunately all the weather station kits from our general stock have been allocated to schools who applied at the start of the project, and they are not currently available for commercial purchase. It is possible that there will be a commercial version of the kit available in future but we do not have any confirmed plans for this yet. However in 2018 we will be launching a ‘Build Your Own Weather Station’ guide which will be based on readily available components and parts. In any event, you can still get involved with the project by accessing the data, using the learning resources available on our website: https://www.raspberrypi.org/education/weather-station/
Ray
For an organisation that supposed to be about bringing computing to the masses and educating our children in the aspects of programming, I find it amazing these kits are not available for the masses to get the wider community involved. If you don’t have the appetite to generate these kits at least publish the circuit diagrams and code.
Antony D’Andrea
Amazing stuff. When I was younger, I had the manual version from the BBC. I kept an ExCel spreadsheet and a diary to record temperature, wind speed and water falling every day. I loved putting it all together to make charts.
I must do it again sometime, but this time it doesn’t have to be so manual!
Mark “Skeptic”
The numbers in the charts don’t seem to match up. For example, in England in July, if average daily rainfall is about 0.01 mm, then in 31 days the total rainfall should be about 0.31 mm. How can it be 100 mm?
Similar problems occur in both the England and Bavaria charts for multiple months.
Raspberry Pi Staff Richard Hayler — post author
You’re right – those graphs were showing the average of the every-5-minutes rainfall readings for each month. Now corrected thanks.
Andy Berry
Always try http://www.dragontail.co.uk
Fritz
It’s a lot of fun making your own weather station. I’ve done it myself over the last couple of years (after retirement) just starting with a Raspberry Pi and some sensors. If you’re interested what came out of it check http://www.picomet.ch
Rob Ward
Hi Folks,
I have been using Oregon Scientific sensors and intercepting the signals with an Arduino Uno and 433MHz Rx for the last 5 years and now putting out weather details 24/7 on a web server running on a RasberryPi3.
I have developed an original (I believe) graph for wind direction you may be interested in.
I have also designed a 3D printed weather station with Anemometer, Wind Direction and Tipping bucket rainfall sensor (the hard mechanical bits). At the moment it is driven by a dedicated Arduino for demonstration and debugging purposes. I Intend to publish Alpha version on Thingiverse in the fortnight or so.
http://www.laketyersbeach.net.au/weather.html
Cheers, Rob
Manuel G Fraga Castro
Windiest location of the year 2017!!
Wow, thank you very much for this honour.
Take a look at this video of CEIP Noalla Telleiro Weather Station location
https://youtu.be/YDtrPMtz618
Jim finley
I questioned the weather board availability 12 months ago and received the exact same response.
May be available……………..
Amazing comment about the masses being denied useful equipment………..
I am in the process of building a station on a BitScope unopi using an Aduino uno and a raspberry pi……..struggling…..but determined!!
Liz Upton
Well, we can promise that you’re not maliciously being denied useful equipment on a whim! We’ve looked hard into providing a weather station like this commercially, but to do so at a price that’d be acceptable to customers like you at a quality we’d be happy with is proving very tough; the school weather stations you see were provided with some help from some great sponsors.
We *are* still looking into it, and will continue to do so, but I’m afraid there’s nothing on the horizon right now. In the meantime, we’d love to hear more about your DIY efforts – you can always get in touch via our contact page to tell us about stuff we might find interesting.
Comments are closed