World of Light – an interactive feedback map
Using a self-written API, Joshua Krosenbrink gifted the new Usabilla office with the World of Light, a 426 RGB LED-powered map of the world.

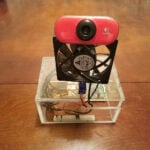
The API pushes user location information to a Raspberry Pi, animating the LEDs in real time to respond to website feedback as and when it’s received by the company.
Joshua spent a decent amount of time using a CNC machine to drill the 426 holes needed, while distributing 30 amps of power to produce the beautiful effect.

More photos of the build can be found at the project’s Hackaday page. While we figure out what we could use this map for at Pi Towers, why not tell us how you would use one in the comments below?


7 comments
Rodd Clarkson
Hook it in to local weather forecasts around the world with different colors indicating different weather and brightness indicating temperature.
Mmmmm, already got me thinking.
You could hook it into the Raspberry Pi Weather Station database.
AndrewS
Fab idea!
Another option would be to light up each LED in turn as the AstroPis in the ISS pass overhead ;-)
Richard Sierakowski
Now that would make NASA jealous:)
Richard
Aaron Thompson
suggestion 1
With all the raspberry pi events world wide you could make a calendar and have the map show upcoming events around the world for the next month and the color could indicate how soon it is.
suggestion 2
Why not just add a small screen to the top or bottom area, open it to the community, and then have it cycle through the submissions. The screen could show the submitter and description or other details about the map.
Addison
Great idea! I love the simplicity!
Leland Green
With all these great ideas, how about a knob, or API (Web interface for the office?) to provide a way to switch between the different modes: weather, website feedback, AstroPi flyovers.
And another idea: Employee location (if it’s an international company). Or even political and geographic data encoding. E.g., population or seismic activity.
Finally, provide a data recording mode for each so that the office can playback the past hour (or day, or whatever) at high speed.
I guess you got me started. :-)
Trevor Mack
Static/Dyanmic Idea #1: Show curvature of day/night on the world.
Optional addition to #1: company color in cities where offices are to let employees know when day/night in fellow offices.
Dynamic Idea #1: current user activity of company’s service {insert product here}
Dynamic Idea #2: live blinks for user product feedback by location
Comments are closed